Podcast Episode: Data, Cloud, and AI for SMBs

Pip: Cooper Mann Consulting has a recurring thesis: before you chase the shiny thing, make sure the foundation underneath it can hold the weight.

Mara: Joanie Mann covers a lot of ground in these posts โ€” QuickBooks reporting infrastructure, cloud resilience for smaller businesses, Microsoft Fabric as a data platform, and what it actually takes to make AI useful.

Pip: Let's start with the reporting question, because it turns out QuickBooks alone may not be enough.

Reporting Beyond QuickBooks Enterprise

Mara: The core tension here is that QuickBooks Enterprise Desktop is genuinely capable software โ€” cost-effective, flexible, widely used โ€” but its built-in reporting has a ceiling.

Pip: The post puts it plainly: "Many businesses eventually outgrow the reporting capabilities available directly inside QuickBooks Enterprise Desktop." That's the inflection point the whole piece is built around.

Mara: And the consequence is concrete. When you hit that ceiling, you're not necessarily shopping for a new accounting system. You're looking at extending what you have โ€” pulling QuickBooks data into Azure infrastructure and surfacing it through Power BI.

Pip: Which is a meaningfully different conversation than "time to rip and replace."

Mara: Right. The post walks through what that extension actually delivers: custom report design, consolidation of data from other operational systems, interactive dashboards, automatic data refreshes across devices, and handling for larger datasets using Azure's elastic infrastructure.

Pip: That last one matters for businesses that have been running long enough to accumulate serious data volume โ€” the reporting slows down before anything else does.

Mara: The scalability argument carries through to a companion piece, Unlocking Insights in QuickBooks Enterprise Data, which frames this as an AI-readiness question too. Once QuickBooks data is centralized in a governed data warehouse or lakehouse, it can feed forecasting and anomaly detection โ€” not just dashboards.

Pip: So the reporting upgrade and the AI foundation are the same project, just described at different stages.

Mara: And a third piece, Unlock KPIs and Improve Reporting with QuickBooks, backs up to the starting line: businesses that haven't yet captured the right operational data can't build meaningful KPIs from it. The post makes the point directly โ€” "No data means no KPIs." You have to get the data right before the reporting layer has anything real to work with.

Pip: Which is a polite way of saying the ledger cards have to go first.

Mara: That thread connects directly to the cloud question โ€” where the data lives shapes what you can do with it.

Cloud Flexibility as a Business Strategy

Mara: The cloud resilience post reframes what resilience actually means for a small or midsized business today.

Pip: The post puts it this way: "Cloud flexibility won't remove uncertainty, but it can change how the business faces it… from reacting under pressure to responding with confidence, agility, and control."

Mara: What that looks like in practice is scaling resources seasonally, enabling secure remote access, deploying tools faster, and strengthening backup and recovery โ€” without rebuilding the technology foundation each time something shifts.

Pip: And the post is careful to say this doesn't have to happen all at once. You start where the value is most immediate.

Mara: That phased framing is what makes the cloud conversation feel like a business decision rather than an infrastructure project. Speaking of infrastructure โ€” Microsoft Fabric is where that foundation gets built.

Microsoft Fabric for Growing Businesses

Pip: The Fabric post is aimed squarely at businesses drowning in spreadsheets โ€” which is most of them.

Mara: The framing is direct: Azure data platforms and Microsoft Fabric can replace "spreadsheet chaos" with a centralized analytics environment, eliminating file version issues and the need for manual consolidation entirely.

Pip: So the upshot is a live business dashboard pulling from QuickBooks, Shopify, HubSpot, Square โ€” whatever the business already uses โ€” without custom integrations.

Mara: And the post emphasizes that getting started doesn't require a dedicated data team. That's the practical threshold for most small businesses. Which brings us to the question of what happens when AI enters that environment.

Fix the Data Before AI Touches It

Mara: The AI posts share a single argument: AI doesn't fix bad data, it scales it.

Pip: Fix the Data, Then Let AI Scale It puts the problem in terms any field-service business will recognize โ€” jobs marked complete in one system but not invoiced in another, customers duplicated across platforms, manual spreadsheet patches holding the whole thing together.

Mara: The post is direct about the consequence: "Imagine training your AI on this data. It isn't going to resolve the data issues or repair them, it will repeat them at scale."

Pip: That's the part AI vendors tend to skip in the demo.

Mara: Data Is the Real Competitive Advantage extends the argument beyond any specific software stack. It asks four questions worth sitting with: Do you trust your core business data today? Can you explain where key numbers come from? Are your processes documented and consistently followed? Do you have a single, reliable version of the truth?

Pip: If the answer to any of those is no, the post's advice is clear โ€” fix the data first, then consider the AI layer.


Mara: The thread across all of this is the same: the foundation has to come before the capability built on top of it.

Pip: Data before AI. Cloud before scale. Reporting infrastructure before the dashboard you actually want. Next time, we'll see what else is in the queue.

Advance Your Analytics and Reporting for QuickBooks Enterprise Desktop

Office workers analyzing business data and graphs on multiple computer monitors

QuickBooks Enterprise Desktop remains a strong fit for businesses that need more functionality and flexibility than Intuitโ€™s online editions provide. Its cost is far lower than most ERP systems, and with the right add-ons, extensions, and reporting infrastructure, it can support sophisticated accounting, inventory, manufacturing, and operational needs. For many QB Enterprise customers, the next opportunity is not replacing QuickBooksโ€”it is strengthening the analytics and reporting environment around it.

Many businesses eventually outgrow the reporting capabilities available directly inside QuickBooks Enterprise Desktop. They may need more flexible dashboards, consolidated operational data, cleaner KPI definitions, or faster access to information across departments. An external reporting approach can address those needs by extending QuickBooks data into a broader analytics environment.

Mendelson Consulting and Noobeh recommend using Microsoft Azure data infrastructure and Power BI to create a single source of truth for analytics and reporting. In this model, QuickBooks Enterprise Desktop and other operational systems feed a governed reporting foundation, so leaders can work from consistent data, trusted metrics, and timely insight when decisions need to be made.

QuickBooks provides useful built-in reports, but an external reporting approach can deliver deeper customization, broader data integration, and more advanced analytics. With Mendelson Consultingโ€™s support, businesses can build a reporting foundation that combines QuickBooks data with information from other operational systems, giving leaders a more complete view of performance.

For organizations that rely on QuickBooks Enterprise Desktop every day, an external reporting strategy can turn accounting and operational data into a more flexible, scalable decision-support system. The following benefits explain why many growing businesses choose to extend QuickBooks reporting with Azure data infrastructure and Power BI.

Why should a business with QuickBooks Enterprise Desktop consider using an external reporting approach alongside QuickBooks?

Advanced Customization

Power BI allows you to design reports that provide exactly the insights youโ€™re looking for, tailoring reports to align with your specific needs and metrics.

Data Consolidation

If your business uses other software systems or databases in addition to QuickBooks Enterprise Desktop, we can help connect to and consolidate data from those sources into a single reporting environment, giving you a holistic view of your businessโ€™s performance.

Data Visualization

Power BI has sophisticated data visualization capabilities, allowing you to create interactive charts, graphs, and dashboards. These visual elements can help you interpret data more easily and make informed decisions.

Cross-Platform Reporting

Noobeh creates Azure data infrastructure that enables automatic refreshes for Power BI data, giving teams access to current reports and analytics across devices and platforms. Power BIโ€™s web and mobile access helps leaders monitor performance from anywhere while giving remote and mobile users more timely information.

Data Transformation

Using tools with data transformation and cleansing features, Mendelson Consulting and Noobeh can enable preparation of data for reporting without altering the original data in QuickBooks or other original sources.

Large Dataset Handling

For businesses with substantial amounts of data, Noobeh uses Azure elastic data infrastructure to handle larger datasets more efficiently and with greater agility, providing for faster reporting performance.

Long-Term Scalability

As your business grows, your reporting needs will become increasingly complex. Power BI, supported by a strong data infrastructure foundation, can scale to accommodate greater data volume, more complex reporting requirements, and broader analytics needs.

Microsoft Fabric, Azure, and Power BI can provide the foundation for a strong analytics environment, but successful implementation requires planning, data modeling expertise, security design, and ongoing support.

Working with an experienced team helps reduce the learning curve and ensures the reporting foundation is built for reliability, usability, and scale. Mendelson Consulting and Noobeh can help build the data infrastructure and reporting environment needed to turn QuickBooks Enterprise Desktop data into stronger analytics, clearer business intelligence, and better decisions.

Together, Mendelson Consulting and Noobeh bring a rare combination of strengths: deep QuickBooks Enterprise Desktop expertise, practical accounting and operational knowledge, and advanced Microsoft cloud and data infrastructure capabilities. That combination matters because effective reporting is not just a technology projectโ€”it requires understanding how the business runs, where the data originates, what leadership needs to see, and how to build a scalable foundation that can grow with the organization.

With Mendelson Consultingโ€™s decades of experience helping QuickBooks Enterprise customers solve real business challenges and Noobehโ€™s expertise in Azure data infrastructure, Microsoft Fabric, and Power BI, businesses gain more than dashboards. They gain a trusted team that can design, build, and support a reporting environment grounded in clean data, meaningful KPIs, and actionable insight.

Let Mendelson Consulting and Noobeh help turn your QuickBooks Enterprise Desktop data – and the data across your broader operations – into a connected analytics platform that supports better decisions today and scales for tomorrow.

If your team is ready to move beyond static reports and gain faster, clearer insight from QuickBooks Enterprise Desktop and your broader operational data, contact Mendelson Consulting to start building a reporting foundation that supports better decisions today and scales with your business over time.

High-Value Uses of Microsoft Fabric for Small and Growing Businesses

Small business owners around the country are finding increasing value in working with Noobeh to leverage the benefits of Microsoft Azure platform and Microsoft Fabric, with practical scenarios that deliver real benefits without enterprise-level complexity.

Eliminate Spreadsheet Chaos

As an example, Azure data platforms and Microsoft Fabric can replace โ€œspreadsheet chaosโ€ with a centralized analytics environment. This approach eliminates file version issues and totally eliminates the need for manual consolidation. Also, where Excel isnโ€™t exactly a real-time reporting engine, this new approach could be.

For finance, sales, project management, and operational teams drowning in spreadsheets, Microsoft Fabric lets you store all your data in one place, have dashboards that refresh automatically, and virtually eliminate the wrangling of manual spreadsheets.

Automating data collection from apps already in use

Many businesses have adopted web-based applications and services for their businesses, which has created more data silos where valuable information is stored. A typical small business might use a variety of online tools like:

  • QuickBooks / Xero
  • Shopify / WooCommerce
  • HubSpot / Mailchimp
  • Square / Stripe
  • ServiceTitan / Jobber

In many cases, Noobeh can use the Microsoft platform to connect to these systems so you can select and pull data automatically and on schedule, replacing manual exports to get updated data. This approach allows you to build a live business โ€œcontrol panelโ€ without having to pay to develop custom application integrations.

Imagine having a unified business dashboard that could provide your business with a single source of truth, showing sales performance, cash flow and invoice status, inventory levels, progress on projects or jobs, various important operational KPIs, or even marketing funnel metrics.

When Microsoft Fabric and Azure Data Infrastructure Work for Small Business

For Noobeh clients, getting started with Microsoft Fabric and Azure data infrastructure services doesnโ€™t take a lot of engineering to get started.  If your business struggles with scattered, inconsistent, or manually managed data, Noobeh can deliver the solution with Microsoft Fabric and Azure platform services. Thereโ€™s a solution for when you use multiple SaaS or SaaS and desktop applications, or even just multiple desktop applications, and you need combined reporting. There is a solution for leadership who wants a unified business dashboard, and there is a solution when there is interest in future AI but no clean data layer yet.

With Noobeh and Microsoft Fabric and Azure data infrastructure, you donโ€™t need a dedicated data team. Fabricโ€™s low-code tools, Power BI and Copilot make it all available, and Noobeh helps you get it going.

bunny feetMake Sense?

J

Unlock KPIs and Improve Reporting with QuickBooks

It is surprising how many businesses still keep boxes of 3×5 ledger cards with customer and vendor information on them. More likely than the card box, the business may be storing its essential customer billing and vendor product information in the accounting system because that is the system they have.

These growing businesses need a better system to capture more information that delivers greater detail for accounting and reporting purposes. Just as likely, the business has other information it should and possibly could be capturing but isnโ€™t sure about what steps to take next.

When details that inform a process are not part of an integrated system, it creates greater potential for lost or inaccurate data. The larger the volume, the more difficult and error-prone managing the information becomes.  

Business needs more detailed information aboutโ€ฆ everything.

Businesses may need to track time for payroll or jobs or both, job tracking may be a requirement, inventory tracking or more detailed inventory management may all be areas for greater attention. Mendelson Consulting can help develop these capabilities by making sure the business is using the right software, and then enabling the functionality needed to support the workflow and capture more and better data.

No data means no KPIs.

More and better data means more information to fuel KPI reporting. Key performance indicators can reflect operational performance in a variety of areas and may help identify where improvements are required.

Using data from the accounting and operational systems, businesses of all sizes measure their effectiveness using KPIs to evaluate the successes โ€“ or failures โ€“ of their processes and activities.

Mendelson Consultingโ€™s team of QuickBooks Enterprise Experts and ERP consultants provide guidance, implementation and training, and report development to get beyond bookkeeping to proper processes that result in good accounting data. Mendelson’s cloud services team – Noobeh – sets it all up on Microsoft Azure, where data connectors, data warehouses and Microsoft Fabric weave it all together.

Whether just starting out or an enterprise or franchise expanding at a national or global level, we help businesses do more with their systems and software. We understand each stage of business and how to help our clients reach their next best level.

jm bunny feetMake sense?

J

Preparing Your Business for Exploding Growth

Preparing for exploding growth in a business requires careful planning and strategic decision-making. To develop the information necessary to support these activities, businesses must implement their processes and systems to properly collect the data required. Unfortunately, many organizations fail to develop the systems which will support increased activity and business growth, only recognizing after the fact that the process support and the data they need isnโ€™t there. To prevent being caught off guard with more business demand and not enough organization to support it, follow these recommendations to set the business up for success over the long run.

Set clear goals and adjust as required. You need to know what the business purpose isโ€ฆ the objective you hope to achieve with all this activity. Establish SMART goals โ€“ specific, measurable, achievable, relevant, and time-bound. With a set of smart goals and a well-defined objective, the business has a clear direction and a guide to assist in decision-making.

Build infrastructure that is scalable. If the business infrastructure canโ€™t handle increased demand, the business canโ€™t grow effectively. Scalable information technology and software systems, robust production capabilities with adequate human resource availability, and increased efficiency in supply chains will help the business meet increasing demand, while improved reporting and business intelligence helps to anticipate potential bottlenecks, allowing for plans to be developed to address them.

Make sure finance and accounting are set for growth. Strengthen overall financial management and review your financial processes to ensure they can accommodate growth. Implementing the right systems and software is necessary to not just optimize production and operations, but to provide a foundation for establishing sound accounting and financial practices which will help the business secure funding and manage cash flow effectively. A good way to evaluate your preparedness for growth is to prepare financial forecasts and stress tests to gauge your business’s financial resilience under various growth scenarios.

Streamline operations and automate where it makes sense. Evaluation of businesses processes is an ongoing task if your business is to continuously work to improve efficiency and effectiveness. Where opportunities for optimization and improvement exist, consider using automation and technology solutions to help streamline operations and reduce manual effort while remaining focused on enhancing customer experience and satisfaction through streamlined processes and improved service delivery.

Plan for Risk and Contingencies. You should try to identify potential risks and challenges associated with rapid growth, such as increased competition, supply chain disruptions, or changes in customer preferences. Develop contingency plans to mitigate these risks and ensure continuity of the business and operation. It may even make sense to consider diversifying your revenue streams to reduce dependency on a single market or product.

Monitor, adjust and adapt as needed. Key performance indicators (KPIs) should be regularly monitored, as should market trends, to stay informed about your businessโ€™s progress and to stay on top of industry developments. Use data analytics and reporting tools to gain insights and make data-driven decisions instead of operating on emotion. The business that plans for growth must remain agile and adaptable, adjusting strategies and operations as needed to accommodate changes in demand as they occur.

Preparation for rapid growth requires a proactive approach and continuous evaluation of your business’s readiness. Regularly reassess your strategies, make necessary adjustments, and stay focused on delivering value to customers as you scale.

Mendelson Consulting and the Noobeh cloud services teams are advisors and consultants with expertise in scaling businesses, and can provide valuable insights, guidance, and support throughout the growth process and beyond.

jm bunny feetMake Sense?

J

Small Businesses and Performance Data โ€“ Analytics are more important than ever

Creating and keeping a competitive edge is critical to building a successful business.ย  Developing a plan, monitoring the plan to make sure the business remains on target, and setting goals for growth and profitability are foundations of business success.ย  But great strategy and detailed planning cannot ensure success because the economy and businessย environments are unpredictable; no amount of planning is a guarantee that bad things wonโ€™t happen and the business wonโ€™t experience challenges.ย  On the other hand, regularly monitoring small business performance data can reveal trends and indications that things are not going as expected, and provide a basis for making the decisions necessary to get the business back on track and regain the competitive edge.

Business owners must be prepared to make adjustments as conditions change, acting on decisions made based on business performance data.ย  While business analytics are more important than ever, with businesses facing volatility in financial markets and increasingly globalized competition, finding a way to approach the matter is often the biggest barrier.ย  The growing difficulty – the increasingly expanding problem facing business owners and their advisors – can be distilled down to three particularly noticeable trends.

An Aberdeen Group report from Nov 2011 titled โ€œThe Analytical SMBโ€ identifies these trends as More Data, More Users and Less Time.

More Data

  1. The volume of data flowing into organizations is already high and is increasing.
    1. The data is complex
    2. The data lacks similarity (data is disparate)

The volume of information flowing in to businesses is already high, and is increasing steadily.ย  With all the data collection applications and tools available, and as the business seeks to gain more information and intelligence from more sources, the volume of information gathered by businesses has increased at astounding rates.ย  Technology has adapted to this need, allowing businesses to gather than store vast amounts of data.ย  To be of value, however, the data must be analyzed to find the answers to questions posed.ย  What technology is only now beginning to address is the complex and disparate nature of the collected data.ย  Coming from varying sources and in equally varying formats, data must be โ€œnormalizedโ€ and related for it to make much sense.

More Users

  1. More business decision makers in more job roles and functions are getting involved
    1. More people approaching the problem with their own โ€œbrandโ€ of analysis

In a very small business, decisions are generally made by the owner.ย  This is most often due to the fact that the owner is the person who not only knows whatโ€™s going on in the business, but is generally the one doing a lot of the work.ย  As businesses grow and bring in personnel to manage various functions, these managers become decision-makers.ย  Decisions are made in businesses at all levels, and as management layers are compressed, those โ€œcloser to the actionโ€ are being handed more responsibility for the decisions impacting their areas.ย ย  Without a comprehensive and company-wide framework for data analysis and reporting, these individuals and workgroups find ways to capture and analyze the data they feel is pertinent to their requirement and within their own realm.

Less Time

  1. Timeframe for making decisions is shrinking, and is shrinking at an โ€œalarmingโ€ rate
    1. The โ€œvelocityโ€ (rapidity of motion) of business is increasing

It may be that, in some businesses and markets, certain decisions donโ€™t have to be made with any great speed.ย  Businesses or markets of this type are tough to find these days because the Internet, information technology and connected systems have all but eliminated the effects of time and distance. Just about everything in business today moves at a rapid pace, and that means that business decisions are often demanded on-the-spot, providing little time for detailed consideration and working through the problem.ย ย  Without the tools and data providing meaningful real-time visibility into business performance, decision-makers may be able to act fast but not wisely, and are most frequently guided by their โ€œgut feelโ€ as to what the right move is.

Driving Small Business Analytics

Business decision makers are now recognizing the need to know more about the business and how it is operating and competing in order to effectively address the choices and decisions faced each day.ย ย  The cause for this recognition may be due to variable elements, but the conclusion reached was the same: good business decisions require business analytics to support them.

Not surprising was the report finding โ€“ that the majority of small business owners felt pressured to adopt a business analytics solution primarily due to the fact that โ€œcritical business decisions rely too much on โ€œgut feelโ€.ย  Surprise! Other drivers listed were lack of visibility into operational metrics, the growing number of people in the business who want analytical capability, the businessโ€™s inability to identify and act upon business opportunities, and having less time to make decisions.

Steps to Get There

As with any business project, there are โ€œdegrees of successโ€, and the ultimate success of a business initiative requires that all parties be on board with it.ย  Businesses who recognize a need to improve their analytical capability, but who do not then empower their systems, processes and people, will not achieve the same result as those who do.

Focusing on the business data, it is important to address both the volume and disparity by creating formal data management practices and policies, and implementing systems and processes which assist with the intelligent capture and storage of business information.ย  Simply retaining the data is not useful; it must be presented and applied in a meaningful manner for it to become useful as decision-supporting information.ย  The value of the information increases dramatically when it becomes truly useful to the business.ย  Additionally, by empowering a broader framework for data collection and analysis, businesses extend the โ€œintelligenceโ€ to others in the organization, supporting individual and workgroup efforts to make better decisions for their respective areas of responsibility.ย  Of course, if the information is not provided in a timely manner, its value is reduced if not eliminated (hindsight may be 20/20, but that doesnโ€™t help you see where you going to step next).ย  Any approach to building business intelligence should leverage connectivity and integration to provide a timely delivery of complete information how and when it is needed.

Whatโ€™s the Proven Benefit?

source: article
source: article

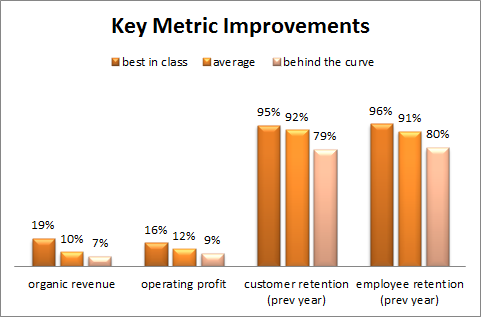
The obvious benefit of business analysis is that business owners are provided with data to help them understand more about the business operational and financial performance.ย  The real and proven benefit is that the information provides a basis for gaining insight into trends and conditions which impact performance, and which support making the necessary decisions which facilitate improvement in various business areas.

The highest level of proven benefit, according to the Aberdeen Group report, was achieved by those businesses who embraced the requirement to know more about the organization and operation, and who implemented a focused effort at building business intelligence.

Fast Facts:ย Best-in-Class SMBs Achievedย 24% year over year increase in new customer accounts sold compared to 12% for the industry average, and 11% for the laggards.

These organizations which achieved the greatest improvement operated from real data rather than being guided by gut and emotion, enabled the entire organization to participate in the development of organizational and business intelligence, positioned themselves to identify and act on new business and market opportunities, and ensured that those who must make decisions have the information and insightful data to support making the right ones.

Make Sense?

J

read more about